
Source of aggregated data
Before digging into the nuances of aggregated data, it's crucial to double-click to ensure we all know where the bars come from and how they are created.
At the foundation of the aggregation are the trades, aka raw tick-level data. Trades show the strength of demand and supply, as well as high and low prices. A trade is an event when an instrument transfers ownership at a specific exchange. In the US, all trades are executed through a National Best Bid Offer (NBBO), ensuring that the buyer pays the best available price.
Let’s take a closer look at Apple, Inc. (AAPL). Despite the popular misconception that its shares are only traded on Nasdaq, where it had an initial IPO – Apple is traded across many exchanges in the United States. On any given day, thousands of trades happen; in some venues, the volume would be more significant, and in others, it would be less, but the overall volume is enormous. For instance, on Apr 26, 2024, there were 563,929 trades.
A simple method to calculate bars
Trade data is further combined to create aggregates. But how is the tricky question. Let’s explore it with an example.
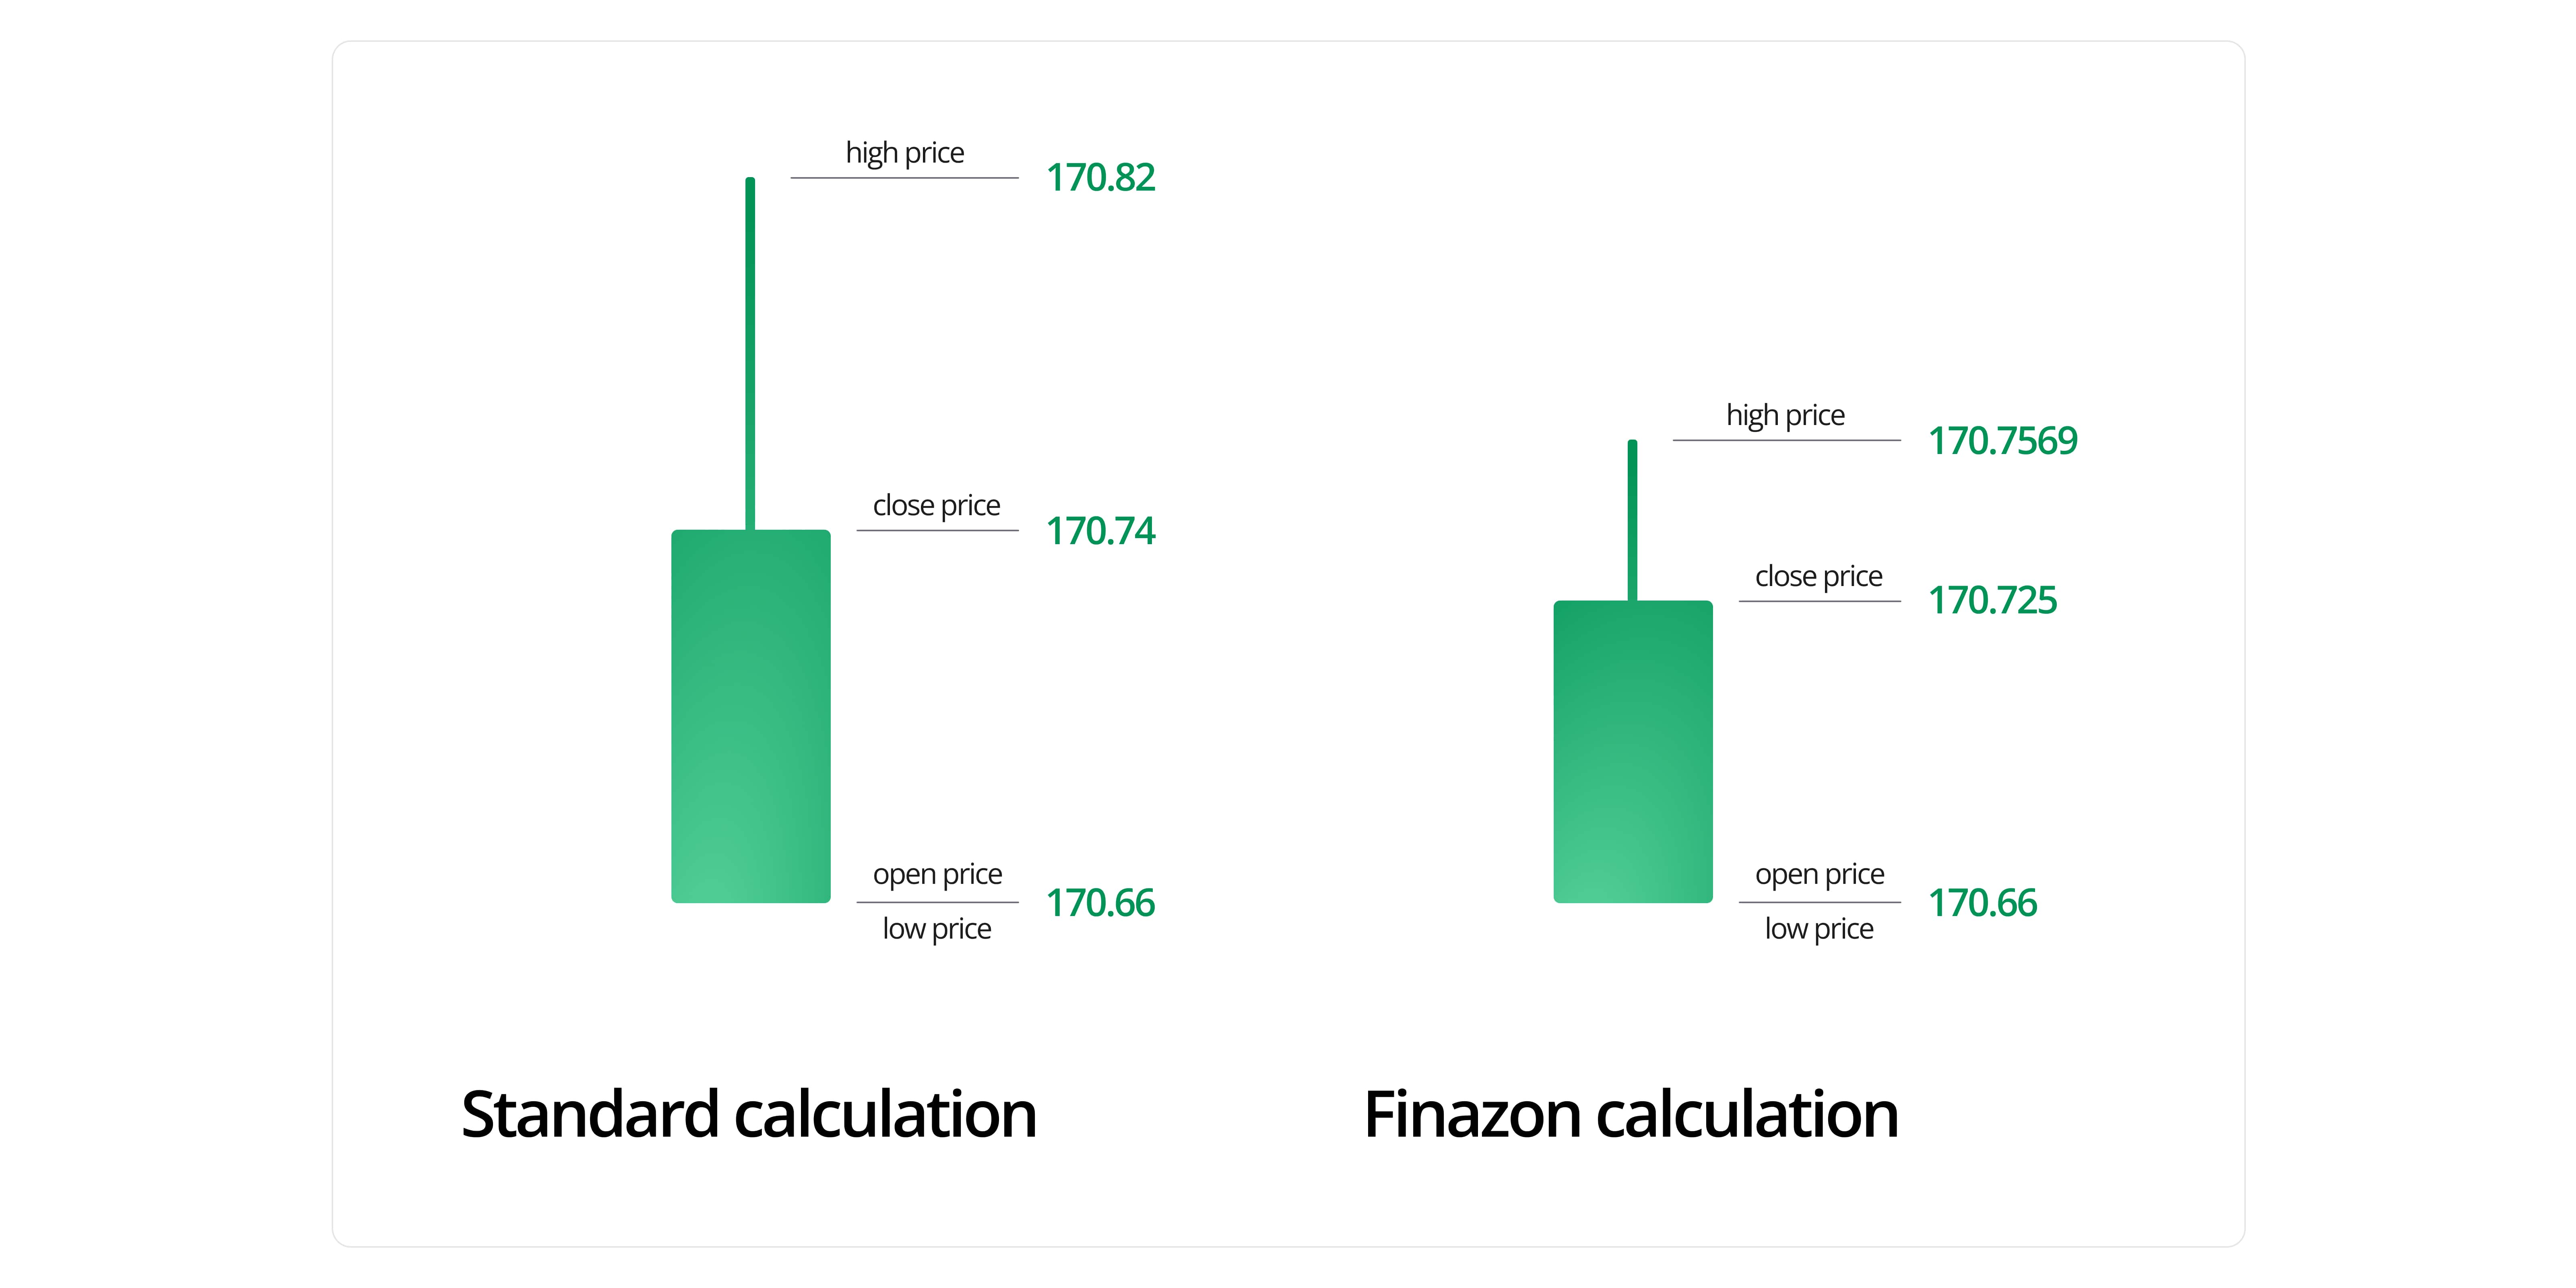
Here are AAPL trades between 10:30:00 am and 10:31:00 am on Apr 26, 2024:
- 3,217 trades
- $170.66 price of the first trade executed, with a 1714141800009 timestamp
- $170.66 price of the lowest price trade executed, with a 1714141800009 timestamp
- $170.82 price of the highest price trade executed, with a 1714141849846 timestamp
- $170.74 price of the last trade executed, with a 1714141859984 timestamp
At a glance, forming a candle seems straightforward. However, the devil is in the details, and now, the types of trades are not considered. Currently, there are 26 types of trades in the US, ranging from regular sales to reverted ones. When you apply those rules, the final result will look different.
The approved way to calculate the bars
Here at Finazon, we follow the canonical calculation method described by our partners UTP and CTA. These entities, also known as SIPs, are responsible for every trade in the US exchanges and, hence, are the most significant authority in the North American markets. UTP and CTA have issued extensive documents about types of trades and their recommendations for aggregation; you can explore these documents here and here, respectively.
When Finazon receives raw trades, we check which rules apply since multiple rules can be used simultaneously. It is a non-trivial task involving exclusions, conditions, and rare events to be considered. Additionally, some trades can be reverted or canceled, making adjusting the history complicated. Finazon has developed a unique proprietary algorithm that decides how the bar should be updated for our REST API and WebSocket API in a few milliseconds. It took us over 12 months to debug the process and make any interval from 1-second to 1-month blaze accurate.
Data differences across the Internet
You will see different data while browsing different portals or data providers for two main reasons.
- Data source. Working with every exchange in the country is expensive, costing a few hundred thousand dollars annually. Only a few data vendors decide to commit to that, and as a result, others choose to work with a subset of exchanges, for instance, only with Nasdaq or NYSE or with a free exchange such as IEX. Since only some customers need ultimate precision, many services offer a limited amount of aggregated exchanges. It’s important for users to understand where the data comes from. For instance, if a trader is using the data from an online portal that visualizes the data being collected from venues with 40% of the total volume, it might create some surprises when that trader tries to purchase that stock via a broker at completely different prices.
- Technical complexity. Paradoxically, even the most established data industry players still make mistakes. For instance, we were able to report a few cases of discrepancies in Nasdaq’s aggregated data API. It’s not a big deal, but even if mastodons of the data might fail, what else to say about smaller vendors without that level of financial and technical expertise.
The definition of the “correct” data
Combining the above two reasons, it is clear why not every price is the same. It is not necessarily wrong, but it is essential to understand the nuances. For day traders, the precision of the price in a given second might not be a priority, so that they will be okay with a smaller exchange coverage. High-frequency traders can’t afford to sacrifice even cents of precision, so they should have the ultimate access to every market. At Finazon, we created US equities datasets for both of the cases.
US Equities Max is the ultimate solution that contains data from every exchange in North America. It is the best option for individuals (no licensing fees) or companies (requires licensing).
US Equities Basic contains data from three venues, with an average volume of 5% of the total. It doesn’t require exchange fees and is straightforward for companies to access the data in a few minutes.


As we now see, one of the most popular notions in the world of finances is widely misinterpreted. I hope you will clearly define the right precision required for your case and find the right tools to rely on.